Waar zit het goud in je ongestructureerde tekst en data?
Voor jullie gevonden:
How to transform unstructured text data into gold – with MindManager 2018

When you’re faced with a significant volume of unstructured text data, how do you discern patterns within it? How do you make sense of it? Not surprisingly, mind mapping software can help you transform it into valuable insights that are worth their weight in gold.
I was recently faced with this challenge when I reviewed the verbatim responses from the 2017 Mind Mapping Software Trends Survey. Each time I conduct this survey, I download these comments to review them. But it’s hard to see patterns when you’re staring at a spreadsheet with over 100 entries. The bottom line is that I didn’t use this valuable reader input as much as I should have, because it was simply too hard to do.
This time around, I wanted to change that. I got to thinking about ways to move this data into a more flexible format so I could see patterns and group bits of feedback into meaningful collections. So I experimented:
Step 1: Copy all of the comments and paste them into MindManager
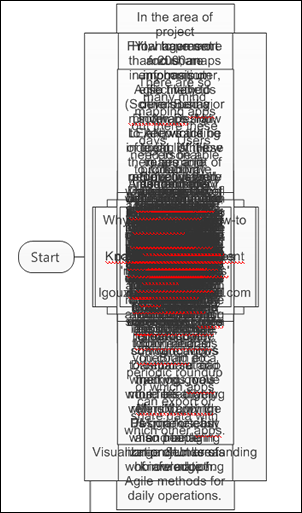 I opened the CSV file containing the survey comments, and copied all 108 rows. I then switched to MindManager. In the file menu, create a new flowchart. That will enable you to manipulate all of your responses as floating topics. If you try this in a new mind map, all of your topics will be connected to the central topic.
Step 2: Clean up the topics
As soon as I pasted all of the data into MindManager, I immediately discovered three challenges:
- First, it pasted everything into a vertical column of topics, one per comment, down the middle of the workspace. In other words, instead of spreading them out across the workspace, all 100+ of them were piled on top of each other. Drag and drop them into approximate columns.
- Some of the comments were very LONG. That created very lengthy map topics in MindManager. If you have any topics like this, edit and summarize them into a more concise format.
- Other topics combined several suggestions into a single map object. I used MindManager’s copy and paste tool to remove text from one topic. When I selected the Windows paste command, MindManager automatically created a new topic containing that text. Nice!
In retrospect, I should have done some of the topic shortening and division in Excel. It would have saved me a lot of work. Yes, this step is time consuming, if you have a lot of data. But trust me – it will all be worth it later!
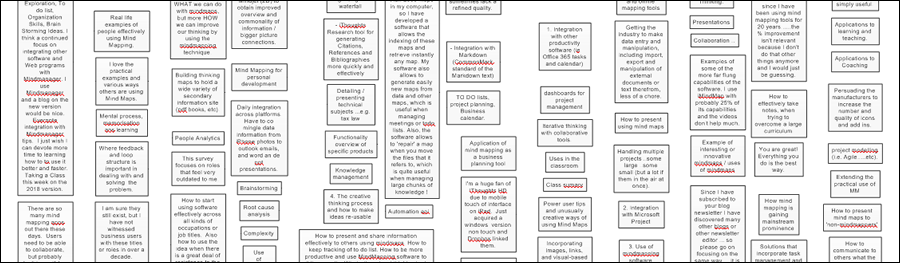
Step 3: Move related topics into proximity to each other
 At this point, if you’re working with a lot of data, you may find that many topics are in your way. Create some open space and move related topics at least into proximity with each other. Take your time, and don’t be afraid to experiment with moving topics around. Not all of them will be a good fit with each other. That’s OK. That’s the beauty of this software – you can arrange and rearrange topics at will.
One nice feature of MindManager 2018’s diagram view is the way in which you can place topics immediately next to each other, with a few pixels between them. Simply drag one topic until its edge slightly overlaps the one you want to position it next to. The program won’t let them overlap. It will reposition the topic you moved just a few pixels away from the other one. Perfect!
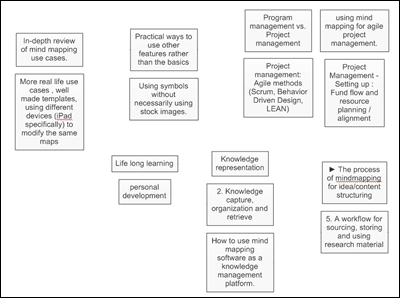
Step 4: Use MindManager’s Power Filter to find related topics
At one point in this grouping process, I realized I had seen several topics that referred to mind mapping “use cases.” But scrolling around my massive cloud of topics, I couldn’t find them. So I turned to MindManager’s Power Filter to do a keyword search on the word “use.” This made all the other topics disappear; only ones that contained the word or text string of “use” appeared. This made it very easy to find those elusive topics and group them together. I highly recommend it as a tool to reduce the amount of visual clutter you’re seeing. It really does help you focus!
To show all of the topics, use the “remove filter” command in the toolbar. If you’re not sure if you’re looking at a filtered view, look in the lower left corner of the workspace. You’ll see a message within a pink rectangular box that states “map is filtered.” You can also right-click on this status box and select “remove filter” from the context-sensitive menu that pops up.
Step 5: Create borders to group topics
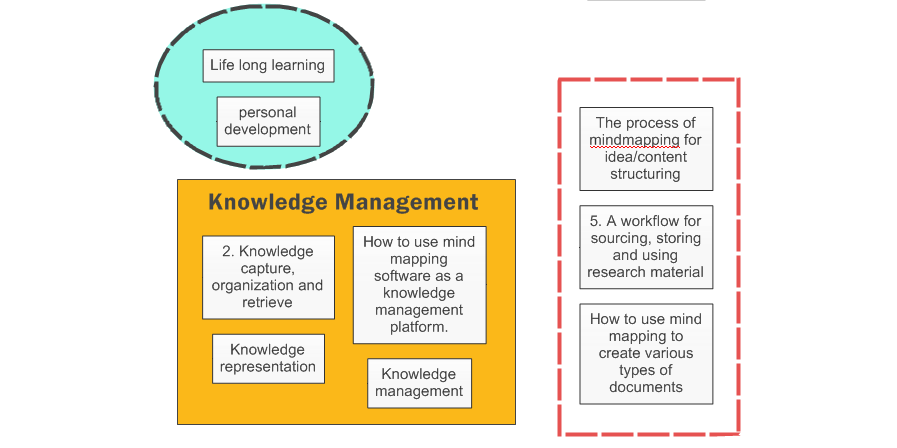
Ideally, you should be able to do this with map boundaries. When I tried to use a boundary to group four topics together, it created boundaries around each individual topic – not what I was going for. Fortunately, MindManager 2018 now enables you to place a variety of shapes onto the workspace, useful for creating business canvases and for other creative map backgrounds.
So I drew a rectangle around four related topics to enclose them; shapes are located in the Insert tab of the ribbon toolbar. Once I did that, I was able to give it a style. Switch to the Design tab and look for line styles and fill colors.
Step 6: Embellish your groups
If you’re so inclined, you can use the Insert/Text Box command to add titles to your topic groups. I experimented to see if I could get a bit more creative. For example, I wanted to create a text box next to one of my topic groups and then use a relationship line to point to it. Unfortunately, that’s not supported.
You can also add icons to individual topics (but not to your topic groupings).
How to assess your topic groupings
The number of topics in each group is an excellent measure of the level of interest in it. For example, I can see from this visual analysis that mind mapping use cases and examples are a major area of interest for my readers. I can add this to my content goals for 2018, to make sure I address it.
You can make decisions based on the verbatim responses. But don’t forget you can also use them to make additional inferences about the data you’ve collected and organized. Add those inferences to your groups – just make sure to format those topics differently so you can tell them apart from the survey responses.
Finally, you can use this type of exercise to precisely zero in the needs of people you’re trying to influence – ideal if you’re writing a blog or other types of content. Here’s how it works:
- Ask an open-ended question to collect verbatim responses
- Analyze and group them
- Launch a separate one-question survey that lists these meta-topics and asks respondents to rate them on a scale of 1-5.
The result is an ordered list of the topics that are most important to them.
This is an awesome way to get people engaged with your blog or website. You’ve given them a blank slate to tell you what they want or need. You’ve then parroted that back to them, within a survey tool that enables them to tell you what THEY think is most important. Finally, simply address these topics in your blog or website in the order your readers ranked them. I did this for a new e-magazine I was launching for my InnovationTools.com website, and the results were phenomenal!
Turns out people LOVE it when you listen to them, and then deliver what they told you they wanted!
The value of this visual sense-making exercise
Why is this data now so valuable? Because I was able to move it from a linear format where it was difficult to discern patterns into a flexible visual format where I could manipulate and group it in ways that made sense to me. Now I’m in a better position to take action on the reader needs that emerged from it.
Why use MindManager for this project? Because it was able to handle a large number of topics without slowing down. Also, it didn’t force me to connect these topics; I was able to arrange and rearrange 100+ floating topics any way I wanted. If I tried this in a dedicated diagramming software program, I’m sure it would have really slowed it down.
Was this sense-making exercise a success? Absolutely!
I will definitely use this data mapping technique after my next mind mapping user survey. I will also be looking for other ways to use it. It’s quite valuable!